
Chief Financial Officer's Report
Section 1 – Financial highlights

GT Pearce Chief Financial Officer |
Our 2020Vision had identified fiscal 2018 as a transition year.
This report is divided into six sections and offers a comprehensive understanding of the Group's financial performance:
- Section 1: Financial highlights
- Section 2: Group financial performance
- Section 3: Regional financial performance
- Section 4: Cash flow
- Section 5: Balance sheet, and
- Section 6: Share price performance.
Section 1
Financial highlights
| (US$ million) | 2018 | 2017 | % change | |||
| Sales | 5,806 | 5,296 | 10 | |||
|---|---|---|---|---|---|---|
| EBITDA excluding special items | 762 | 785 | (3) | |||
| Operating profit excluding special items | 480 | 526 | (9) | |||
| Profit for the year | 323 | 338 | (4) | |||
| EBITDA excluding special items to sales (%) | 13.1 | 14.8 | n/a | |||
| Operating profit excluding special items to sales (%) | 8.3 | 9.9 | n/a | |||
| Operating profit excluding special items to capital employed (ROCE) (%) | 14.6 | 18.0 | n/a | |||
| Net cash (utilised) generated | (254) | 108 | n/a | |||
| Net debt | 1,568 | 1,322 | 19 | |||
| Basic earnings per share (US cents) | 60 | 63 | (5) |
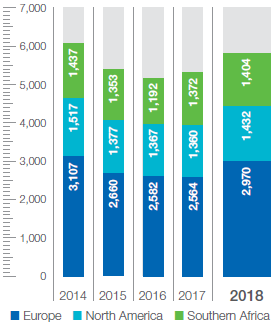
| Sales over five years (US$ million) |
 |
Our 2020Vision had identified fiscal 2018 as a transition year. Following the debt reduction initiatives during the previous reporting periods, the group addressed the capacity constraints in the dissolving wood pulp (DWP) and specialities and packaging papers segments. DWP capacity increased by 60,000 tons and the conversion of printing and writing papers capacity to speciality paper products in our North American and European regions provided us with approximately 550,000 tons increase in specialities and packaging papers capacity. Additionally, the purchase of the Cham Paper Group (CPG) supplemented 160,000 tons of specialities and packaging papers capacity. As a result, capital expenditure (inclusive of maintenance expenditure) and the acquisition of CPG amounted to US$673 million for the year. Cash utilised for the year of US$254 million was managed within our leverage target of two times net debt to EBITDA.
Stronger than expected market demand across all our product segments provided us with high capacity utilisation rates on all our machines. Volumes and net selling prices improved by 2% and 7% respectively causing net sales to increase by 10%. Variable costs increased by 12% in absolute terms, driven mainly by purchased pulp and delivery cost increases. There was a lag in securing selling price increases which squeezed EBITDA margins from 15% to 13%. The increased sales volumes reduced the impact of the lower margins, and EBITDA excluding special items of US$762 million was in line with the previous year after adjusting for the benefit of the additional accounting week of approximately US$20 million.
Net finance costs reduced by 15% to US$68 million as the full impact on the previous years' debt reduction initiatives took effect. The average tax rate of 23% was below the average statutory rate as we utilised assessed losses available mainly in our European operations. Profit for the year was US$323 million (LY = US$338 million) and earnings per share excluding special items reduced from 64 US cents to 60 US cents. A dividend of 17 US cents per share has been declared at a three times earnings cover adjusted for non-cash items.
Cash utilisation for the year of US$254 million includes a dividend payment of US$81 million, tax payments of US$73 million and the acquisition of CPG of US$132 million.
Segment reporting
Our reporting is based on the geographical location of our businesses, ie Europe, North America and Southern Africa.
The selected product line information is reviewed by our Executive Committee in addition to the geographical basis upon which the group is managed. This additional information is presented in this report to assist our stakeholders in obtaining a complete understanding of our business.
Exchange rates and their impact on the group’s results
The group reports its results in US Dollar and, as such, the main foreign exchange rates used in the preparation of the financial statements were:
| Income statement average rates |
Balance sheet closing rates |
|||||||||
| 2018 | 2017 | 2018 | 2017 | |||||||
| EUR1 = US$ | 1.1902 | 1.1055 | 1.1609 | 1.1814 | ||||||
|---|---|---|---|---|---|---|---|---|---|---|
| US$1 = ZAR | 13.0518 | 13.3813 | 14.1473 | 13.5561 | ||||||
Two of our three geographic business units (Europe and Southern Africa) have home or ‘functional’ currencies of Euro and Rand respectively. The results and cash flows of these two non-US Dollar units are translated into US Dollar at the average exchange rate for the reporting period in order to arrive at the consolidated US Dollar results and cash flows. When exchange rates differ from one period to the next, the impact of translation from the functional currency to reporting currency can be significant.