
Chief Financial Officer's Report
Section 5 – Balance sheet
This section provides a comprehensive review of the group's assets, liabilities and equity position.
Summarised balance sheet
| (US$ million) | 2018 | 2017 | |||
| Property, plant and equipment | 3,010 | 2,681 | |||
|---|---|---|---|---|---|
| Plantations | 466 | 458 | |||
| Net working capital | 493 | 436 | |||
| Other assets | 323 | 254 | |||
| Net post-employment liabilities | (261) | (309) | |||
| Other liabilities | (516) | (451) | |||
| Employment of capital | 3,515 | 3,069 | |||
| Equity | 1,947 | 1,747 | |||
| Net debt | 1,568 | 1,322 | |||
| Capital employed | 3,515 | 3,069 |
Sappi has 18 production facilities in eight countries, capable of producing approximately 3.7 million tons of pulp and 5.7 million tons of paper. For more information on our mills, their production capacities and products, see Where we operate.
During 2018, capital expenditure for property, plant and equipment was US$541 million. The capacity replacement value of property, plant and equipment for insurance purposes has been assessed at approximately US$21 billion.
Property, plant and equipment
The cost and depreciation related to our property are set out in the table below.
| Book value of property, plant and equipment (US$ million) | 2018 | 2017 | |||
| Cost | 9,077 | 8,681 | |||
|---|---|---|---|---|---|
| Accumulated depreciation and impairment | 6,067 | 6,000 | |||
| Net book value | 3,010 | 2,681 |
Plantations
We regard ownership of our plantations in South Africa as a key strategic resource as it gives us access to low cost fibre for pulp production and ensures continuity of supply on an important raw material input source.
We currently have access to approximately 516,000 hectares of land of which approximately 379,000 hectares are planted with pine and eucalyptus. These plantations provide approximately 65% of the wood requirements for our Southern Africa mills.
During the year, there were market price increases coupled with higher average fair value rates. These increases were offset by the rising cost of fuel and an increase in the discount rate. As we manage our plantations on a sustainable basis, the growth for the year was offset by timber felled during the year.
Our plantations are valued on the balance sheet at fair value less the estimated costs of delivery, including harvesting and transport costs. In notes 2.3.4 and 11 to the financial statements, we provide more detail on our accounting policies for plantations, how we manage our plantations as well as the major assumptions used in the calculation of fair value.
Working capital
The component parts of our working capital at the 2018 and 2017 fiscal year-ends are shown in the table below:
Net working capital
| (US$ million) | 2018 | 2017 | |||
| Inventories | 741 | 636 | |||
|---|---|---|---|---|---|
| Trade and other receivables | 767 | 668 | |||
| Trade and other payables and provisions | (1,015) | (868) | |||
| Net working capital | 493 | 436 |
Optimising working capital remains a key focus area for us and appropriate targets are incorporated into the management incentive schemes for all businesses. The working capital investment is seasonal and typically peaks during the third quarter of each financial year.
Net working capital increased to US$493 million in 2018 from US$436 million in 2017. The material movements in working capital are discussed below:
- Inventories increased by US$105 million, caused mainly by higher purchased pulp prices. This was partially offset by a favourable currency translation impact of US$13 million
- Receivables increased by US$99 million following higher net selling prices and increased volumes in the fourth quarter. This was partially offset by a favourable currency translation impact of US$9 million, and
- Payables increased by US$147 million. The increase in payables is largely due to a favourable currency translation impact of US$21 million, increased raw material prices and higher accruals for capital expenditure.
Post-employment liabilities
We operate various defined benefit pension/lump sum plans, post-employment healthcare subsidies and other employee benefits in the various countries in which we operate. A summary of defined benefit assets and liabilities (pension and post-employment healthcare subsidies) is as follows:
| Defined benefit liabilities (US$ million) | 2018 | 2017 | |||
| Defined benefit obligation | (1,431) | (1,448) | |||
|---|---|---|---|---|---|
| Fair value of plan assets | 1,170 | 1,139 | |||
| Net balance sheet liability | (261) | (309) | |||
| Cash contributions to defined benefit plans/ subsidies | 40 | 39 | |||
| Income statement charge (credit) to profit or loss* | 18 | 30 | |||
| Cash contributions deemed ‘catch-up’** | 19 | 18 |
| * | The income statement charge in 2018 is lower than in 2017 due to a net negative past service cost recognised in profit and loss. |
| ** | ‘Catch-up’ is cash contributions paid to defined benefit plans in excess of current service cost. |
Gross liabilities from all our plans (funded plans and unfunded) reduced by US$17 million compared with last year. The main cause of the overall decrease was slightly higher discount rates due to rising yields in respective bond markets, a net negative past service cost and net reductions in longevity provisions.
Fair value of plan assets rose by US$31 million over the year due to favourable investment returns of assets in our funded plans from outperforming equity markets.
Included in the liability and asset movements above is a US$3 million gain resulting from movements relative to the reporting currency.
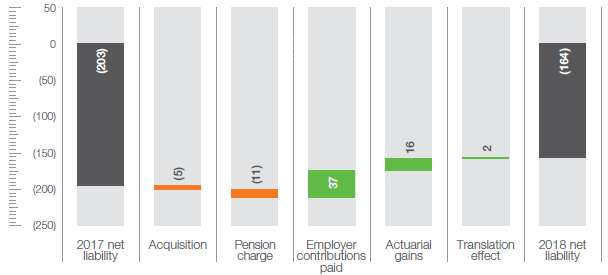
The reduction in liabilities and increase in assets both contributed to a reduction in the net overall net liability by US$48 million as at September 2018. A reconciliation of the movement in the balance sheet over the year is shown graphically below and disclosed in more detail in note 28 of the annual financial statements.
| Sappi Limited defined benefit pensions balance sheet movement (US$ million) | Sappi Limited post-retirement medical aid subsidy balance sheet movement (US$ million) | |
 |
 |
Equity
Year-on-year, equity increased by US$200 million to US$1,947 million as summarised below:
| Equity reconciliation (US$ million) | 2018 | ||
| Equity as at September 2017 | 1,747 | ||
|---|---|---|---|
| Profit for the year | 323 | ||
| Dividend paid | (81) | ||
| Share-based payments | 15 | ||
| Movement in hedging reserves | 4 | ||
| Foreign currency movements | (61) | ||
| Equity as at September 2018 | 1,947 |
The US$200 million increase was the result of the profit for the year of US$323 million offset by dividends paid and foreign currency movements.
Debt
Debt is a major source of funding for the group. In the management of debt, we focus on net debt, which is the sum of current and non-current interest-bearing borrowings and bank overdrafts, net of cash and cash equivalents.
Debt funding structure
The Sappi group principally takes up debt in two legal entities. Sappi Southern Africa Limited issues debt in the local South African market for its own funding requirements and Sappi Papier Holding GmbH (SPH), which is the international holding company, issues debt in the international money and capital markets to fund our non-South African businesses. SPH’s long-term debt is supported by a Sappi Limited guarantee and the financial covenants on certain of its debt are based on the ratios of the consolidated Sappi Limited group. The covenants applicable to the debt of these two entities and their respective credit ratings are discussed below.
The diagram below depicts our debt funding structure.
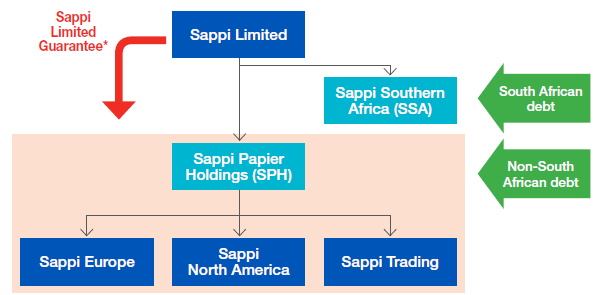 |
| * Sappi Limited provides guarantees for long-term non-South African debt. |
Below we highlight the main financing activities that occurred during the year:
- The previous €465 million SPH Revolving Credit Facility maturing in 2020 was renewed with a new €525 million Revolving Credit Facility maturing in 2023.
- The conversion project at the Somerset Mill is financed with a €150 million term loan. The facility was arranged with the OeKB (Öesterreichische Kontrollbank, an Austrian development bank). This long-term facility is structured as a seven-year term facility with drawings taking place in line with the progress of the project and is now fully drawn.
- The purchase price for the Cham Paper Group acquisition was funded from cash resources at SPH.
- The SSA05 ZAR500 million bond in South Africa was repaid from local cash resources.
- A new biomass project at the Ngodwana Mill in South Africa achieved financial closing during the year. This project will use biomass from the Ngodwana Mill to provide electricity to the South African electricity provider, Eskom. The ZAR1.8 billion (approximately. US$127 million) project is structured on a project finance basis with two local banks and various equity partners. Construction has commenced and the construction period will be approximately 30 months. The contract with Eskom is to supply electricity for an initial period of 20 years.
Structure of net debt and liquidity
We consider the liquidity position to be sufficient, with cash holdings exceeding short-term obligations by US$250 million at fiscal year-end. In addition, Sappi has US$680 million of unutilised committed credit facilities, including the Revolving Credit Facility at SPH of €525 million (US$609 million).
The structure of our net debt at September 2018 and 2017 is summarised below:
| (US$ million) | 2018 | 2017 | |||
| Long-term debt | 1,818 | 1,739 | |||
|---|---|---|---|---|---|
| Senior unsecured debt | 1,471 | 1,436 | |||
| Securitisation funding | 376 | 364 | |||
| Less: Short-term portion | (29) | (61) | |||
| Net short-term debt/(cash) | (250) | (417) | |||
| Overdrafts and short-term loans | 84 | 72 | |||
| Short-term portion of long-term debt | 29 | 61 | |||
| Less: Cash | (363) | (550) | |||
| Net debt | 1,568 | 1,322 |
Movement in net debt
The movement of our net debt from fiscal 2017 to fiscal 2018 is explained in the table below:
| (US$ million) | 2018 | ||
| Net debt as at September 2017 | 1,322 | ||
|---|---|---|---|
| Net cash utilised | 122 | ||
| Cham Paper Group acquisition price | 132 | ||
| Acquired debt, Cham Paper Group | 12 | ||
| Currency and other movements | (20) | ||
| Net debt as at September 2018 | 1,568 |
Group debt profile
We show the major components and maturities of our net debt at September 2018 below. These are split between our debt in South Africa and our debt outside South Africa.
| Amount US$ million |
Interest rates (local currencies) |
Fixed/ variable |
Maturity (Sappi fiscal years) | |||||||
| 2019 | 2020 | 2021 | 2022 | Thereafter | ||||||
| Southern Africa | ||||||||||
| Bank debt | 28 | 7.85% | Variable | 28 | ||||||
| 2020 bond | 53 | 8.06% | Fixed | 53 | ||||||
| Gross debt | 81 | |||||||||
| Less: Cash | (72) | (72) | ||||||||
| Net SA debt | 9 | (72) | 81 | 0 | 0 | 0 | ||||
| Non-Southern African | ||||||||||
| Securitisation (US$) | 134 | 3.53% | Variable | 134 | ||||||
| Securitisation (EUR) | 242 | 1.38% | Variable | 242 | ||||||
| OeKB term loan 1 | 71 | 1.25% | Fixed | 24 | 24 | 24 | ||||
| OeKB term loan 2 | 174 | 2.20% | Fixed | 21 | 21 | 21 | 111 | |||
| Other bank debt | 95 | 0.43% | Variable | 90 | 2.9 | 1.4 | 0.6 | 1 | ||
| 2022 bonds (EUR) | 522 | 3.38% | Fixed | 522.4 | ||||||
| 2023 bonds (EUR) | 406 | 4.00% | Fixed | 406 | ||||||
| 2032 bonds (US$) | 221 | 7.50% | Fixed | 221 | ||||||
| IFRS adjustments | (16) | (16) | ||||||||
| Gross debt | 1,850 | |||||||||
| Less: Cash | (291) | (291) | ||||||||
| Net non-SA debt | 1,559 | (178) | 423 | 46 | 544 | 724 | ||||
| Net group debt | 1,568 | (250) | 504 | 46 | 544 | 724 | ||||
The majority of our non-South African long-term debt is guaranteed by Sappi Limited, the group holding company.
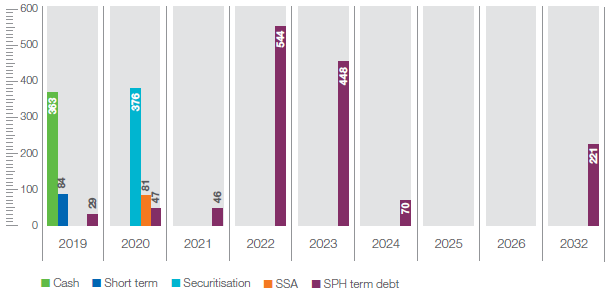
A diagram of the debt maturity profile for Sappi fiscal years is shown below:
| Debt maturity profile for Sappi fiscal years (US$ million) |
 |
Covenants
Non-South African covenants
Financial covenants apply to US$245 million of our non-South African bank debt, the €525 million revolving credit facility and our securitisation borrowings.
The covenants are described below and are calculated on a rolling last four quarter basis and require to be met at the end of each quarter:
- The ratio of group net debt to EBITDA be not greater than 3.75-to-1, and
- The ratio of group EBITDA to net interest expense be not less than 2.50-to-1.
The table below shows that at September 2018 we were well in compliance with these covenants.
| Non-South African covenants | 2018 | 2017 | |||
| Net debt to EBITDA | 2.07 | <3.75 | |||
|---|---|---|---|---|---|
| EBITDA to net interest | 11.18 | >2.50 |
In addition to the financial covenants referred to above, our bonds and certain of our bank facilities contain customary affirmative and negative covenants restricting, among other things, the granting of security, incurrence of debt, the provision of loans and guarantees, mergers and disposals and certain restricted payments. As regards dividend payments, in terms of the international bond indentures, any cash dividends paid may not exceed 50% of net profit excluding special items after tax and certain other adjustments, calculated on a cumulative basis.
South African covenants
Separate covenants also apply to the revolving credit facility of our Southern African business.
These covenants are calculated on a rolling last four quarter basis and require that at the end of March and September, with regard to Sappi Southern Africa Limited and its subsidiaries:
- The ratio of net debt to equity is not at the end of March and September greater than 65%, and
- At the financial year-end, the ratio of EBITDA to net interest paid for the year is not less than 2-to-1.
Below we show that for the year ended September 2018 the South African financial covenants were comfortably met.
| South African covenants | 2018 | 2017 | |||
| Net debt to equity | 0.62% | <65% | |||
|---|---|---|---|---|---|
| EBITDA to net interest | Net interest received |
>2.00 |
Credit ratings
| Global Credit Ratings: South African national rating | Sappi Southern Africa Limited:
|
|
| Moody’s | Sappi corporate family rating:
SPH debt rating:
|
|
| S&P Global Ratings | Corporate credit rating:
SPH debt rating:
|
|